Rails Analytics • Driving 600% Engagement Growth
A net-new business intelligence product that empowers restaurant brands to analyze their ordering data to confidently make informed decisions - increasing customer satisfaction and driving revenue.
IMPACT
600% ↑
Increased user traffic
59% ↓
Decreased time on task
156% ↑
Increased report downloads
My Role
I was the Senior Product Design lead on all phases: end-to-end research, strategy, design, and post-launch data monitoring and enhancements.
Timeline
Multi-year, quartered rollout. Official kickoff, Q2 2021. Most recent major launch, Q3 2022 + ongoing product enhancements and improvements.
Tools
Pen and Paper, Whimsical, Sketch, Marvel, Dovetail, iMovie, WalkMe, Mixpanel, Looker, DataDog, Google Workspace, Jira
About Rails
Rails is the connecting tissue between direct online ordering consumers and third-party marketplaces like DoorDash, Grubhub, UberEats, and many others.
Facilitates $110M+ in weekly sales for our brands (~$5.7 billion annually).
What does this mean for Olo?
$55M+
Yearly Revenue Generated
80,000+
Restaurant Locations
2,000,000+
Daily Processed Orders
4,000+
Brand Users
Problem

Real-time data clarity and insights are essential for our brands to succeed and grow.
Olo was not providing brands with basic, real-time metrics on how their integrations were performing.
• Olo’s current offering: A day-old, technical PDF Looker report.
• Other data sets were scattered across 6+ reports, on different platforms, and various formats. 😱
• Locating, synthesizing, and translating these data sets into actionable insights required significant time and resources for Olo and our customers.
• Rails was at a serious competitive disadvantage due to the lack of accessible and actionable data.
Vision
Provide brands with real-time access to informative, consumable, and actionable data.
Our North Star Focus → DICE
DRIVE Revenue Growth 💸
INCREASE Guest Satisfaction 🤩
CAPTURE Lost Revenue 💰
ELIMINATE Repeat Errors 🚫
Solution

Rails Analytics empowers brands to act on real-time business needs with meaningful insights and informed decision-making, leading to improved overall performance and sustained ordering growth.
(MVP) Performance Data → Aggregated revenue, order amounts, order counts, and store location data.
(v2) Error Data → Top offenders (stores, marketplaces, error categories), error rates, resolution, and revenue recovery.
Public launch and Help Center release video for Rails Analytics. (All content created and editing done by me.)
Full Case Study Deep Dive 🤿
9 min read
• Research Discovery + Findings
• Design Strategy + Deliverables
• Impact
• Reflection
Research Discovery + Findings
Because this was a new investment from the business and a 0-to-1 product, a six-week spike was set to gather as much research and data as possible.
Alignment at this step was crucial for the project requirements and tight delivery timelines.
Goals:
• Surface insights and data consolidation into the overall business and user needs that must be addressed.
• Create a vision and direction for design, without being too prescriptive about how it will be accomplished.
Research Spike

Project Plan for all phases from Discovery to Post-Launch Monitoring
Selected Research Methodologies
Due to the tight research window, I kicked off discovery with a Value-Prop Workshop to align on strategy and set the stage for the research. I brought together stakeholders across 8 organizational domains.
It leveled the playing field and baselined all contributors’ knowledge of the project and its future goals, while providing an expressive space to share, innovate, and collaborate.
This jump-started the discovery process and positively impacted all subsequent decisions and milestones, building the foundation we needed for fast validation and shipping cycles.

Value-Prop Workshop
Goal: Align stakeholders, set goals and strategy, innovate Rails Analytics, and explore customers' JTBD.
Tasks: Created and led a 2-day cross-functional workshop with 15 participants. Designed all materials, documentation, synthesis, and reports from the workshop.
Result: Executive + Stakeholder alignment, validated business goals, product and design strategies, and core JTBD of our users. Had over 90% participation, and over 96% satisfaction rating from post-workshop survey.

User Interviews: Internal and External Stakeholders
Goal: Understand how Olo’s current data systems enable the sharing of performance and error insights, and how brands use those insights to evaluate issues, make decisions, and improve outcomes.
Tasks: Created interview goals and plans, brand outreach and scheduling, led interviews, and analyzed findings.
Result: Validated assumptions and results from the Value-Prop Workshop and the problem we were solving. Uncovered exactly what is important and frustrating with current offerings in the data tooling landscape.

Open/Closed Card Sorts + Impact-Effort Matrices
Goal: Understand what metrics and data points are most important based on their impact on the brand’s business and user goals.
Tasks: Developed qualitative, async activities for brand perspective, insight, and priorities.
Result: Verified all the data requirements into three buckets (Need, Want, Wait) for MVP consideration and future releases. A huge win for our data team as they needed this work to start cleaning, organizing, connecting data endpoints, and start development.
Findings + Key Insights
Our current solution is failing (day-old Looker report). It is outdated, fragmented data, and forces our brands to interpret and act on information that isn't prioritized or actionable.
Brands rely on our competitors and on external tools to meet their real-time analytical needs, generate insights, and drive actionable outcomes.
All-in on Data Literacy and Education. We need to present data in a user-centered way rather than a technical engineering-centered approach.
We are sitting on a treasure trove of ‘messy data'. Ordering data is unclean, unorganized, and non-actionable.
Real-time Business Reporting: Users need accurate, up-to-date data to track business performance.
Centralized Location: Users need a single platform to easily view data from all Olo integrations. This platform should show success and error metrics to better understand business performance, and detailed integration health metrics for quick troubleshooting.
Recommendations, Troubleshooting, and Alerts: Users need timely recommendations, alerts, and actionable steps to increase revenue and recover from losses. They should be easy to understand, quick to find, and easy to act on to fix problems.
Flexible Data Tools: Users need tools for detailed data analysis with customizable sorting and filtering. They require precise data that can be easily shared to communicate insights effectively or to dig into further for analysis.
Voice of the Customer: What the Brands had to say

Research Supercut: Used to build empathy for our brands during stakeholder updates. The video series highlighted major pain points and table stakes.
“...the explanations are technical in nature, causing anxiety amongst store managers who don’t know what the issue is and how to fix it.”
DENNY'S
“I find the information disjointed and scattered…need an organized solution for doing monthly or quarterly metrics dig rather than daily.”
MOD PIZZA
“What now? Need actionable recommendations and next steps regarding the data and what to do with it when I have it.”
PANDA EXPRESS
User Personas: Targeting the Decision-Makers
The research revealed two primary sub-groups, leading us to create sub-personas that prioritize the needs of our core data consumers.
This process not only identified the target users but also fostered a deeper understanding of their daily challenges and motivations, as well as a direct connection to their Jobs to Be Done (JTBD).
Ultimately, our goal was to enhance empathy, ensure our solutions effectively address their unique pain points, and empower them to take meaningful action on the data.

THE DEEP DIVER
Frequency: Hourly/Daily/Weekly Deep Data Analysis
Job Titles: Data Analysts, Digital Managers, One-Person ‘Data Team’.
Role: Part of a small team, juggling multiple responsibilities without specialized support. They are often the only ones analyzing data for their entire organization.
Day in the Life: Daily analysis includes identifying trends, reasons for revenue loss, and performance metrics. They collaborate with partners to resolve controllable errors and seek insights for optimization.
Pain Points: Need to extract and clean data from various sources and tools. Handling different data formats and communicating complex datasets.
Jobs to Be Done: Identify optimization opportunities for Rails integrations through manual data analysis.

THE SNORKELER
Frequency: Weekly/Monthly/Yearly Trends Spotter
Job Titles: Brand Managers, Digital Directors, and Off-Premise Directors.
Role: Work on larger teams with data analysts. Seek high-level snapshots, and prefer insights over manual data analysis.
Day in the Life: Ingest weekly/monthly reports. Focus on error rates, trends, and revenue optimization. Need differentiation between controllable and uncontrollable errors.
Pain Points: Waiting for data teams to analyze trends affecting revenue and customer experience is time-consuming and inconvenient. Fragmented data sets, presentation, and actionable steps for resolution.
Jobs to Be Done: Increase brand revenue and efficiency by using insights for informed decisions.
Design Strategy & Deliverables
User Journey Map
I leveraged the Service Design framework around The 5 E's of the Customer Journey due to its success at effectively communicating complexity, simplifying the holistic experience, and forward-thinking when designing for meaningful services and outcomes.
A user journey map was created to visualize and align the team and stakeholders on the design vision.

From User Journey Vision to Product Execution
To turn our Service Design vision into an actionable product strategy, I translated the user journey map into a phased rollout roadmap. While the 5 E’s framework helped align stakeholders on the holistic experience, this roadmap grounded that vision in clear priorities, timelines, and deliverables.
It showed how brand questions evolved from performance awareness to actionable optimization, sequencing features in a way that balanced business impact with technical feasibility. This clarity reduced ambiguity, aligned cross-functional teams, and ensured each release built toward a more intelligent, action-driven platform.


Wireframes + Usability Enhancements
With Rails losing market share month over month, speed to market became a critical priority. I deliberately focused on low- to mid-fidelity wireframes rather than high-fidelity designs to accelerate validation, reduce production overhead, and keep the team aligned under tight delivery timelines.
After clearly outlining the trade-offs with leadership, I aligned on a system-first approach by leveraging our design system (Storybook) and Highcharts to establish a consistent visual foundation while moving quickly. I grounded the experience in familiar UX patterns from products like Stripe and Mixpanel (Jacob’s Law of UX), minimizing user learning curves and allowing us to focus innovation on insights and JTBD workflows that mattered most.
Through rapid prototyping and continuous moderated and unmoderated usability testing, I validated assumptions early, refined critical flows in real time, and de-risked development.
This approach enabled us to ship an MVP on schedule while setting a strong foundation for future enhancements.
Select screenshots focusing on key interactions and design strategy evolution.
High-level overview of Rails Analytics experience and key screens.

Data Table focuses on Insights + Actions users can take from the data, directly in the product experience.
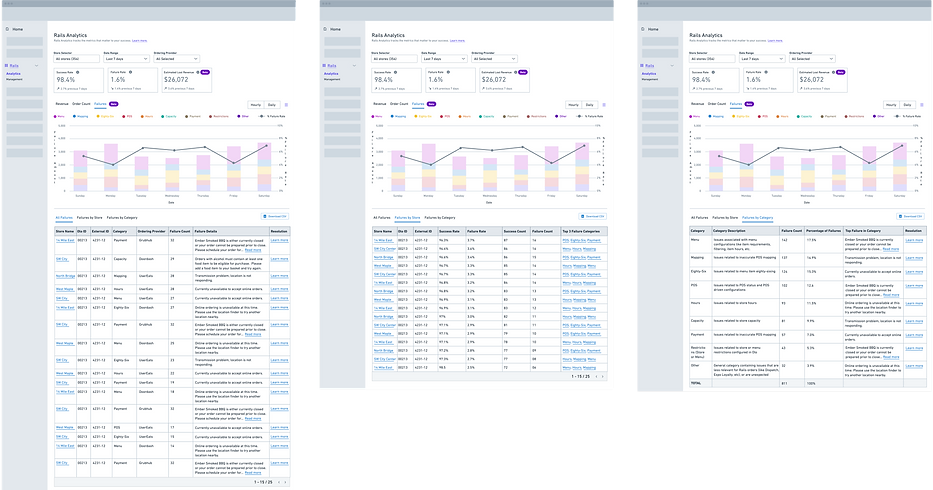
Data Filtering experience and options for users to surface only the data that matters to their JTBD and critical workflows.

Every aspect of our users' JTBD and North Star guides starts from the landing/overview page. Thus, providing the right data at the right time allows the choice to drill into more granular datasets.
Continuous product evolution and progress towards our North Star focus → DICE (DRIVE Revenue Growth • INCREASE Guest Satisfaction • CAPTURE Lost Revenue • ELIMINATE Repeat Errors).


Impact
Mixpanel

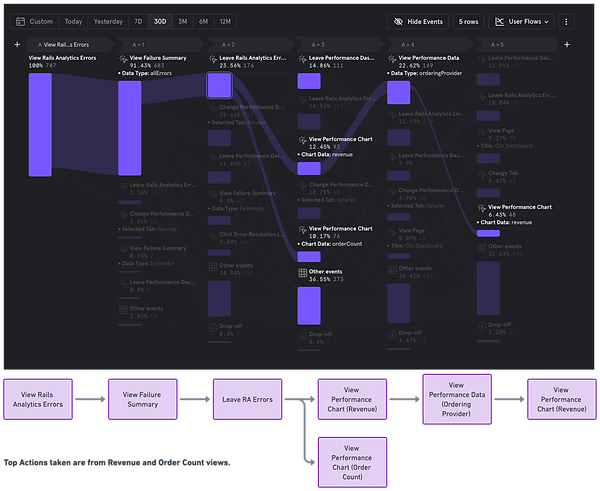
Mixpanel was used as our primary tool for product analysis and event data collection. The features and collection methods used were event tracking, analyzing user groups, studying user flows, testing design variations, and segmenting users and groups.
It helped me validate and facilitate product decisions, visualize bottlenecks in user flows, and help with enhancement prioritization.
Measurable Results
Tracking Events: 600% increased user traffic after launching Error Metrics.
User Flow Analysis: 59% decrease in time on task (from 4+ min to 2 min 40 sec) after including deep-linking in the data table.
A/B Testing: 156% increase in chart images and CSV downloads, after moving the button location to a more natural area in the page design (Fitt’s Law of UX).
Key user flows are tracked and analized for further optomization and enhancement opportunies.
WalkMe
A valuable aspect of the design process is monitoring user engagement during onboarding and offering opportunities for in-the-moment feedback and product learning. WalkMe was used to facilitate this part of the experience.
I tracked completion rates and pinpointed where users may disengage during onboarding. The findings informed enhancements to relevant education and feedback synthesis for later feature prioritization.

Key Results:
Shout Out: A custom message scheduled to appear to first-time users informing them of the newly launched Rails Analytics product and its feature set.
-
80%+ of first-time users triggered the Smart Walk-Thru.
Walk Thru: An on-screen tour and guidance of the page by pointing to and explaining key workflow-optimizing features.
-
54% of first-time users completed the full Walk-Thru during onboarding.
-
17% of returning users triggered the action again to leverage its content and guidance.
Survey: Surveys were used to collect user feedback in the moment. With custom prompts, we collected rating data on their experience and product ease of use, and open-ended questions to gather additional related product feedback.
-
18% of all users completed one response, and several of our power users continued to share feedback through open-ended inquiries.
Reflection
The Rails Analytics project was a high-impact, rapid-development initiative that successfully launched a foundational business intelligence (BI) tool for Olo's restaurant partners. Focused on troubleshooting performance and error metrics, this 0→1 BI Tool demonstrates the power of data storytelling to drive operational efficiency.
Key Successes and Impact
The launch of the Rails Analytics MVP delivered immediate, measurable value to users:
-
User Traffic: A 600% increase in user traffic following the release of the Error Metrics feature.
-
Efficiency Gains: A 59% reduction in time on task for restaurant teams to make a business-impacting decision.
-
Data Consumption: A 156% increase in report downloads for chart images and CSVs, indicating high user utility and adoption of the data for offline analysis and sharing.
This project's success confirms that providing a unified, self-service dashboard to translate complex data into clear, actionable insights is a critical need for restaurant brands.
The rapid deployment validated a lean, MVP-focused strategy that delivered core utility quickly.
The metrics on reduced time-on-task and increased user engagement are direct evidence that the tool successfully simplified troubleshooting and empowered brands to confidently make data-informed decisions.